Skip to content
I’m Dhiraj Chouhan

Share this portfolio

Dinero was a real, 2-year product. Some data values, quotes and metrics are modified or representative to protect participants and institutional data.

← Back to Home Page

DineroInternal Platformfor Masters’ Union

UX Research Case Study

From an 8-step manual admissions journey to a unified platform: serving 1,000+ students, eliminating 3–5 hours of daily admin overhead and converting an external payment link into 93% in-app completion.

  • User research
  • Product design
  • Double Diamond
  • EdTech
1,000+
Students onboarded
87%
Usability task success
93%
Payment completion (A/B)
<1 hr
Admin daily overhead
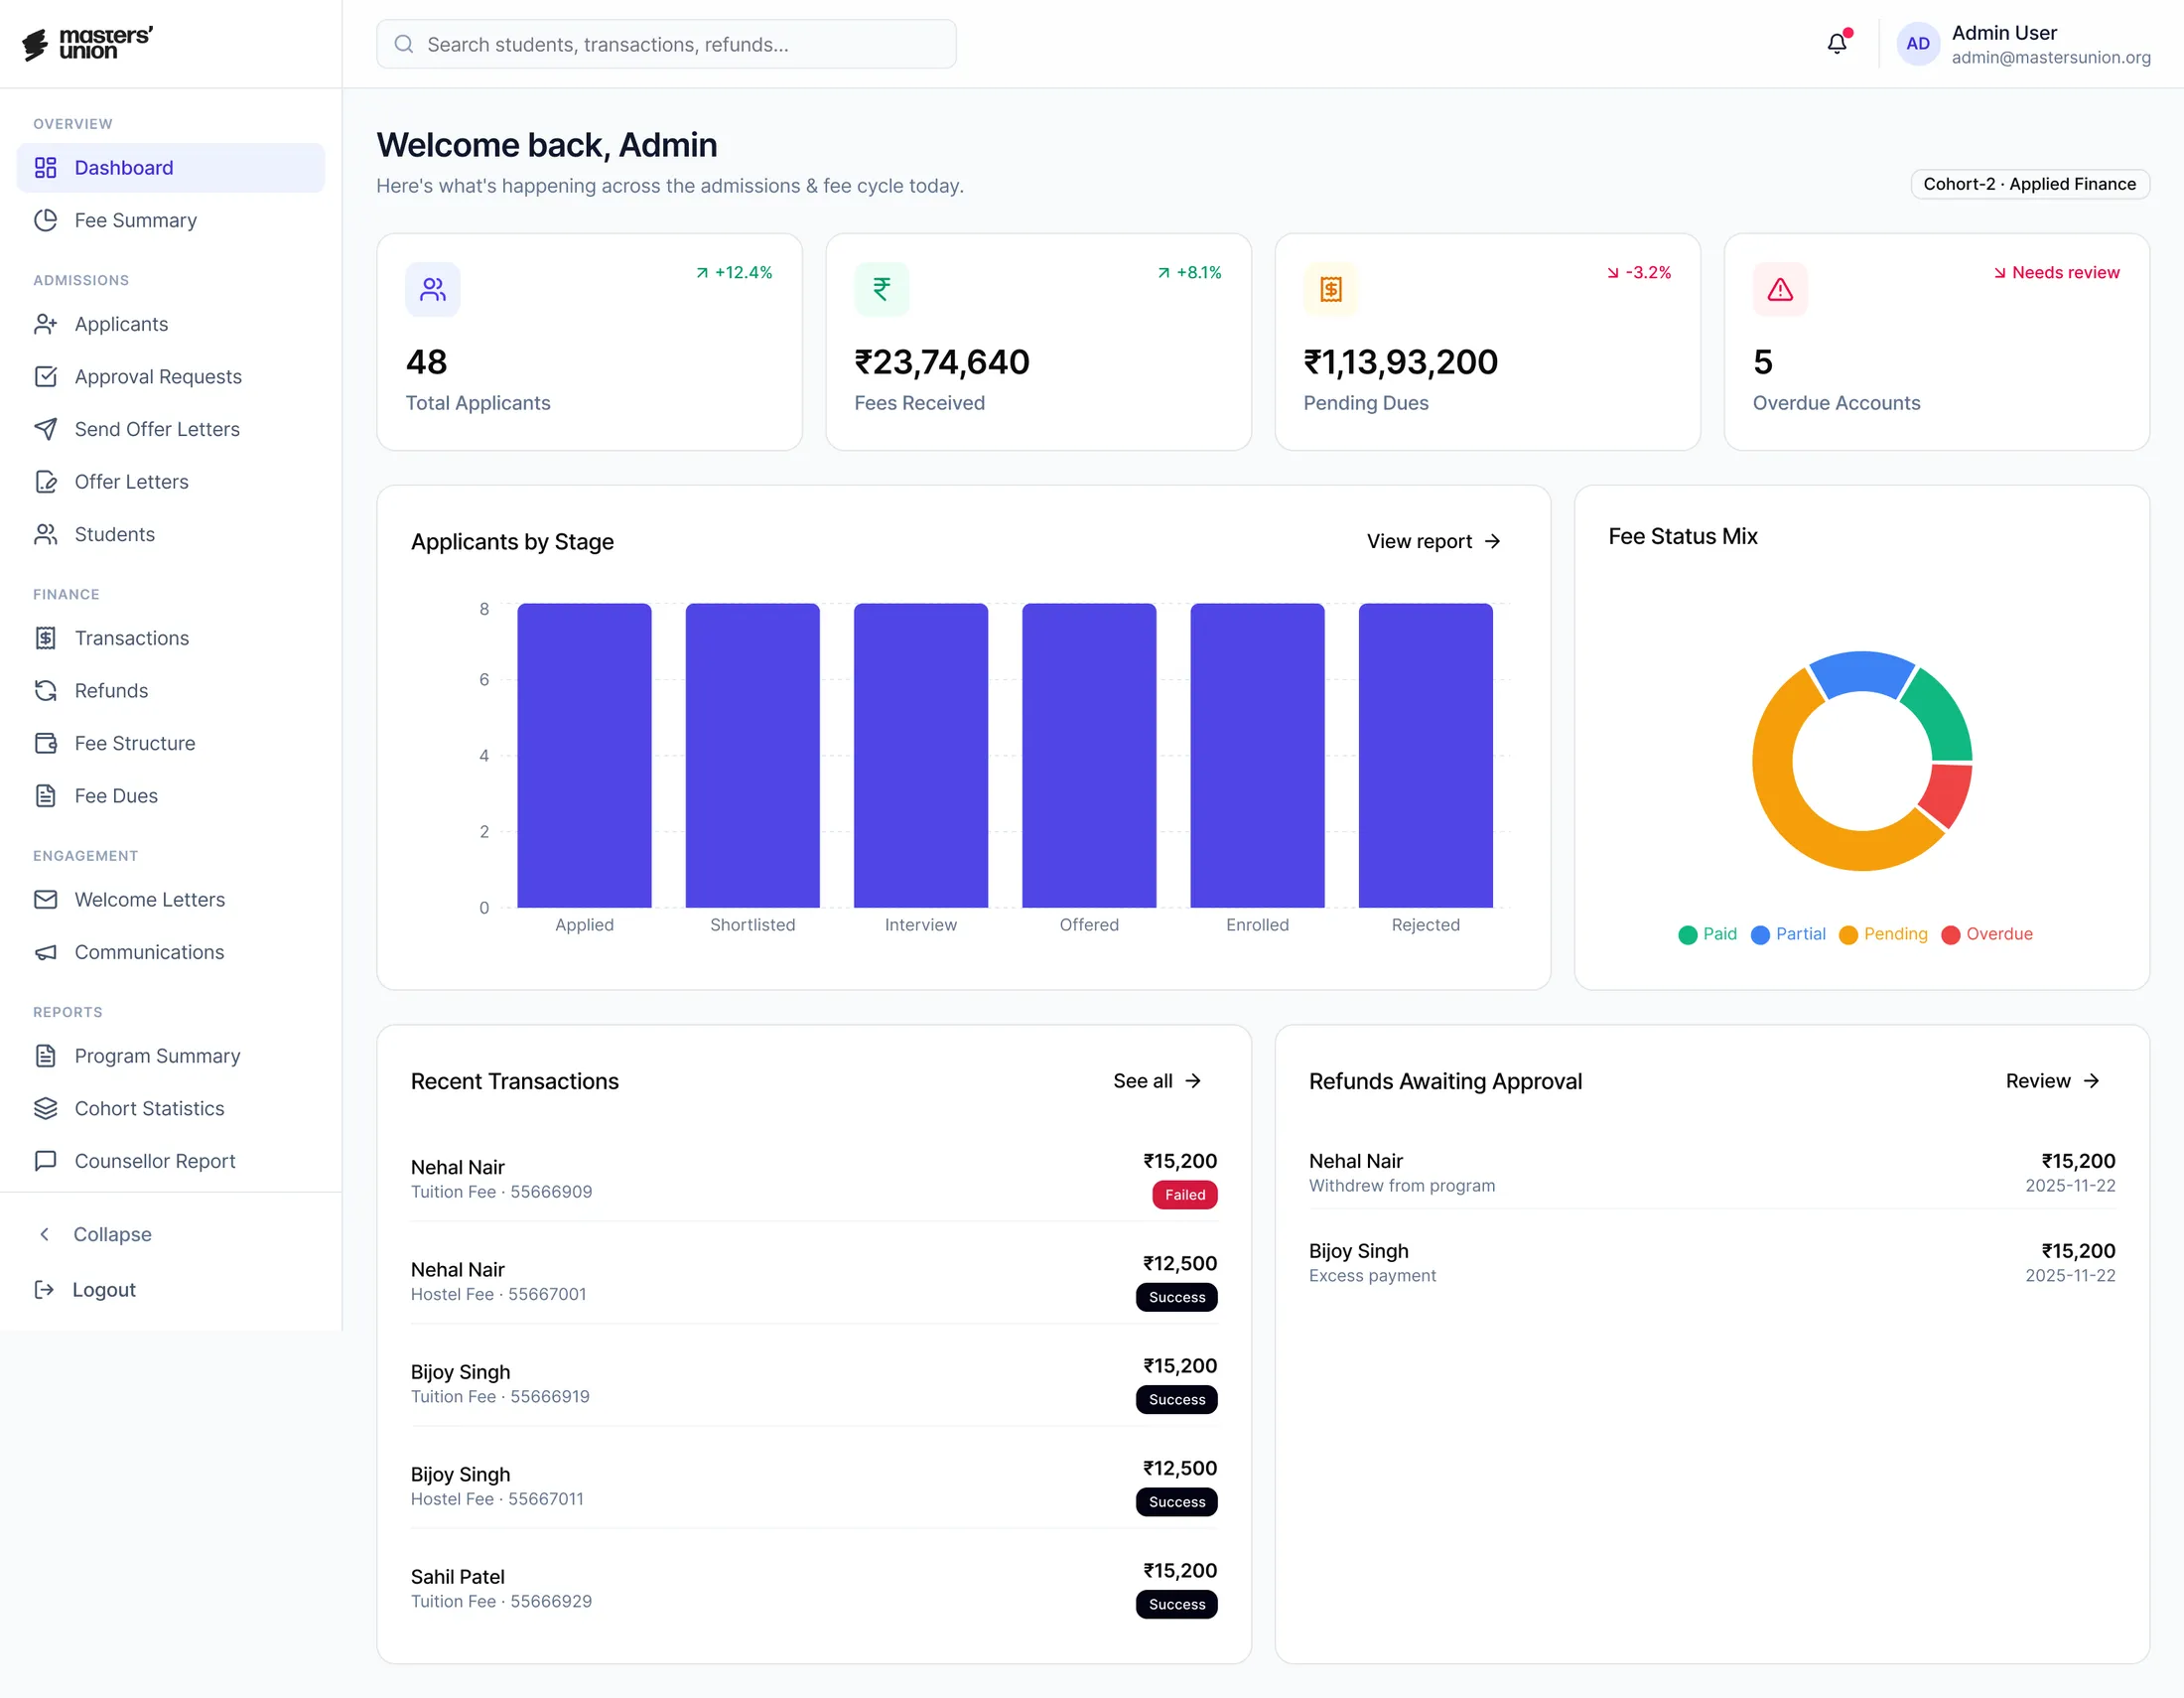
The Dinero admin dashboard: applicants, fees received, pending dues and overdue accounts at a glance
Framework
Double Diamond
HEART · GSM
Timeline
2021 – 2023
Team
1 PM · 3 UX/UI Designers
8 Engineers · 2 QA
Tools
Figma · Miro · Notion

Part 1

The Problem

Context

Two systems, no connection

Masters’ Union is a tech-first business school that scaled rapidly, but its internal operations couldn’t keep pace. Two disconnected systems ran the entire admissions and fee cycle.

NPF: captured applications and stored student records.

Pinelab: processed fee payments as an external gateway.

Problem

Neither system talked to the other. Every handoff was manual. Every status update was a spreadsheet entry. Students clicking a payment link in an email, for a Rs.3,50,000+ transaction, were landing on an unbranded external page they had never seen before.

Pre-Dinero

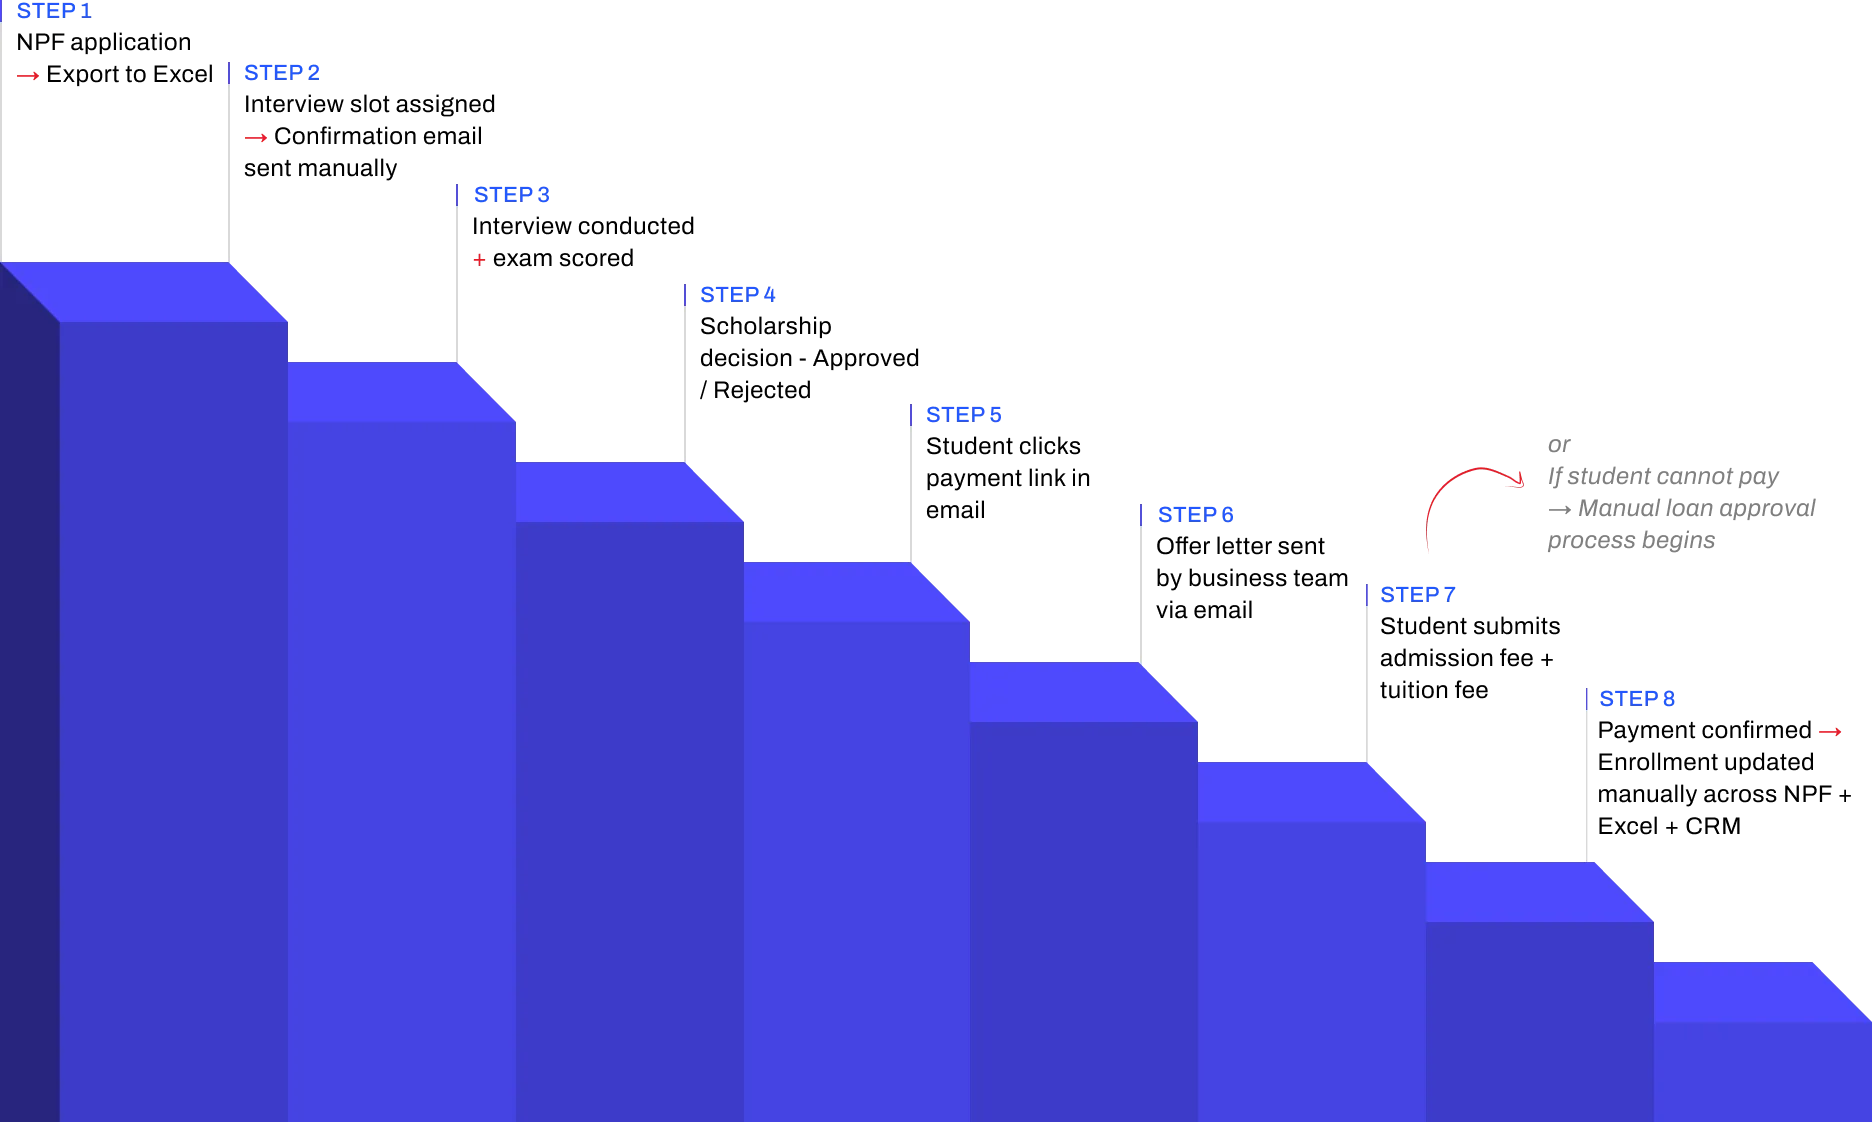
The real 8-step manual journey

The 8-step manual admissions journey as a descending staircase: step 1, NPF application → Export to Excel; step 2, Interview slot assigned → Confirmation email sent manually; step 3, Interview conducted + exam scored; step 4, Scholarship decision: Approved / Rejected; step 5, Student clicks payment link in email; step 6, Offer letter sent by business team via email; step 7, Student submits admission fee + tuition fee; step 8, Payment confirmed → Enrollment updated manually across NPF + Excel + CRM.
The admissions tracking spreadsheet, one of the manual tools behind the journey
Total overhead: 3–5 hours of non-value-added admin work daily.

Part 2

Research

Timetable

How it all happened

18 weeks, from the first stakeholder session to Figma Dev Mode handoff.

Oct 2022 – Feb 2023

Week 1–2Week 3–4Week 5–6Week 7–8Week 9–10Week 11–12Week 13–14Week 15–16Week 17–18
  • Stakeholder interviews · Research plan finalisation · Participant recruitment
  • User interviews: Students (5 sessions) · Admin (3 sessions)
  • User interviews: Faculty (3 sessions)
  • Competitive analysis
  • Card sorting
  • Affinity mapping · JTBD framework · Persona development · Journey mapping
  • Wireframing · Lo-fi to mid-fi prototype (35 screens)
  • Round 1 usability testing, 5 participants
  • Design iteration based on Round 1 findings
  • Round 2 usability testing · Heuristic evaluation
  • Hi-fi UI · Design system (30 components) · Figma Dev Mode handoff
  • 5
    Students

    User interviews · Card sorting · Usability testing

  • 3
    Admin

    Contextual observation · User interviews · Usability testing

  • 3
    Faculty

    Stakeholder interviews · Workflow validation

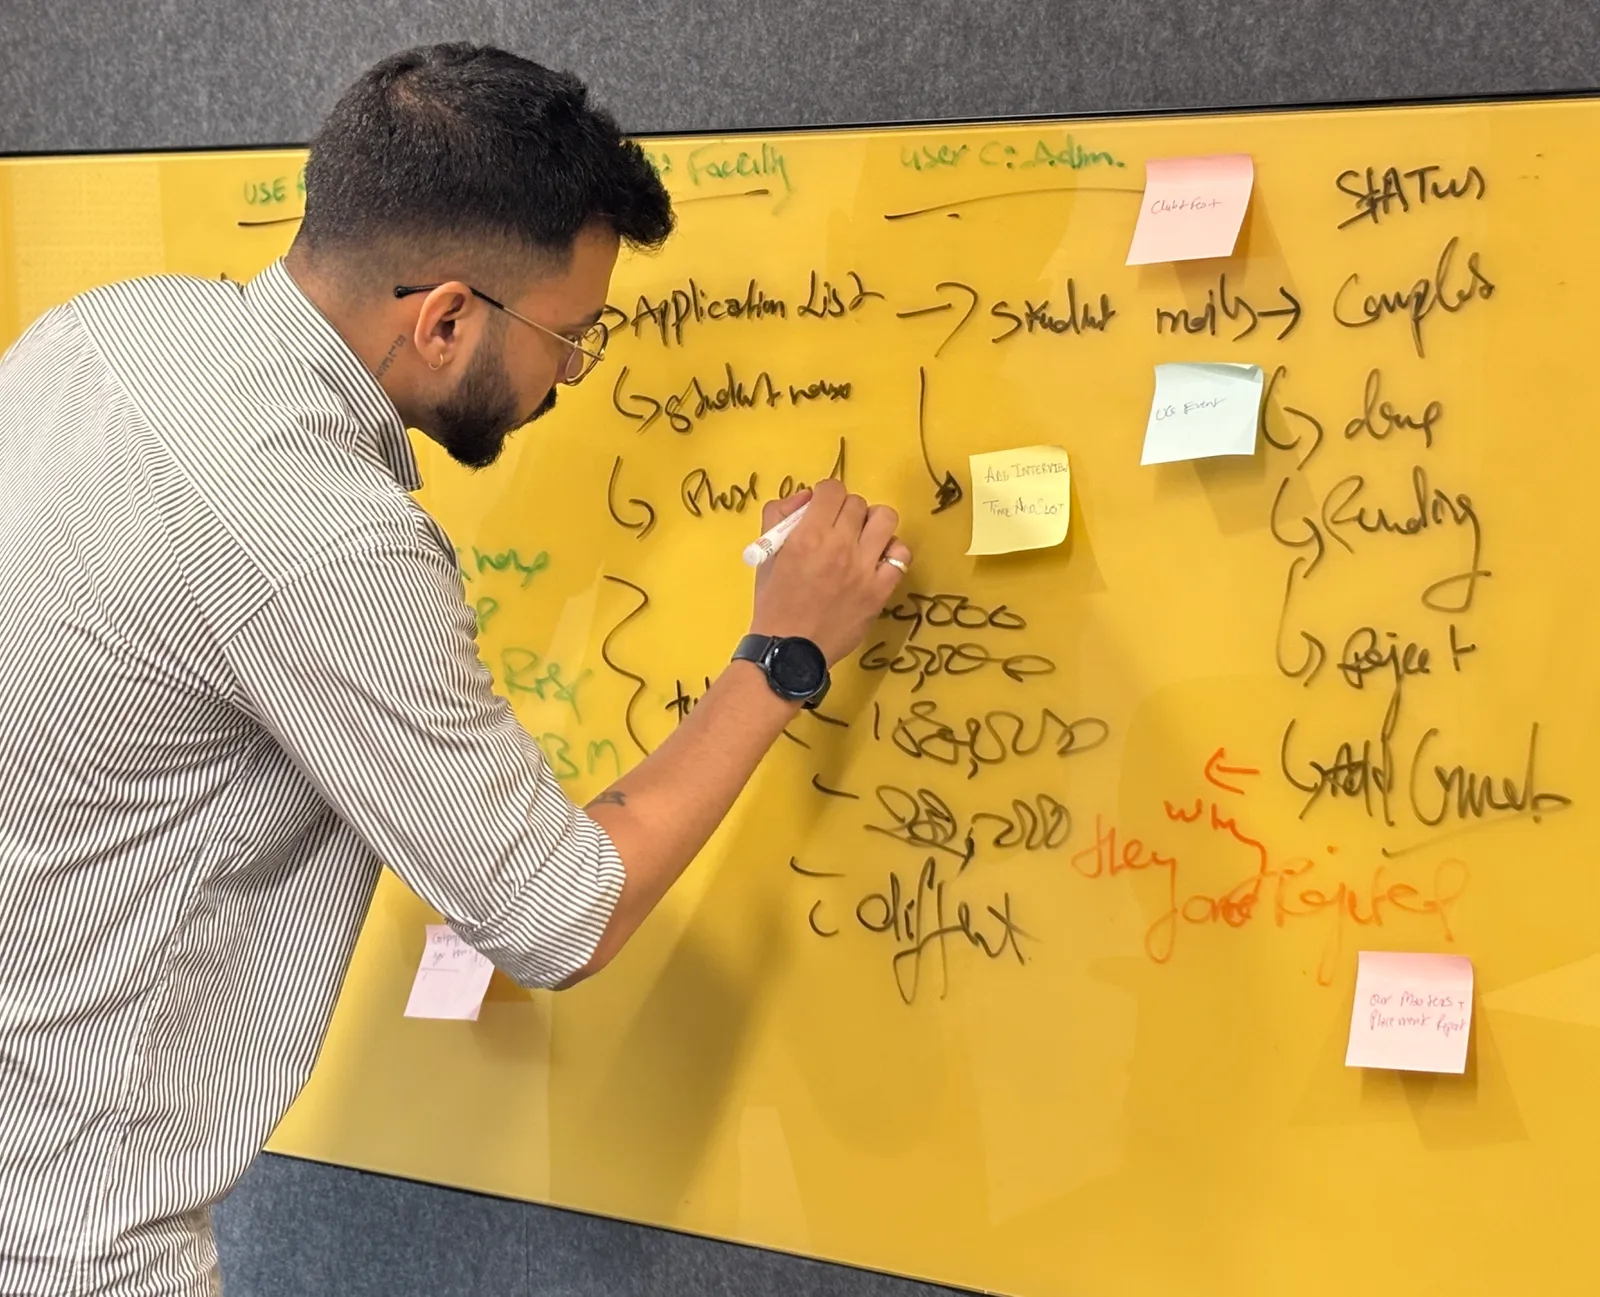
Dhiraj mapping the application flow on a yellow glass board

Alignment

Three tensions that reframed the brief

Before talking to end users, we aligned with product, admissions and finance. The goal was not to gather requirements. It was to understand how each of them defined success.

  1. 1

    Leadership believed the problem was “students not completing payments”. Research revealed it was a trust design problem, not a student behaviour problem.

  2. 2

    Admins said their manual effort was “1–2 hours” a day. Contextual observation revealed the real number was 3–5 hours.

  3. 3

    No stakeholder had ever mapped the full 8-step journey end-to-end. It had never been documented in one place.

Landscape

What already existed

We audited what was already in daily use, then scanned the market. No one tool owned the journey from application to enrollment.

Used for

Gap that drove Dinero

NoPaperForms
Used forApplication intake · student record storage
Gap that drove DineroNo workflow operation: admins exported to Excel for every action
Excel
Used forManual tracking of interview scores · scholarship decisions · payment status
Gap that drove DineroNo single source of truth · multi-hour daily reconciliation
Pine Labs
Used forExternal fee payment gateway
Gap that drove DineroNo Masters’ Union branding · 14–15 day manual reconciliation · ~25% abandonment

Optimized for

Gap we observed

NoPaperForms
Optimized forLead capture and applicant CRM for Indian institutions
Gap we observedStrong on intake; limited on post-admission workflows
Flywire
Optimized forGlobal tuition payments with multi-currency and compliance
Gap we observedStrong on payment infra; not built to own admissions lifecycle
Blackbaud
Optimized forStudent information systems and reporting (US/UK focus)
Gap we observedStrong on records; required heavy integration for Indian context

Synthesis

Affinity mapping

11 interviews and 2 contextual observation sessions produced ~190 data points. Every observation went onto its own sticky note, then we grouped bottom-up, with no predefined categories.
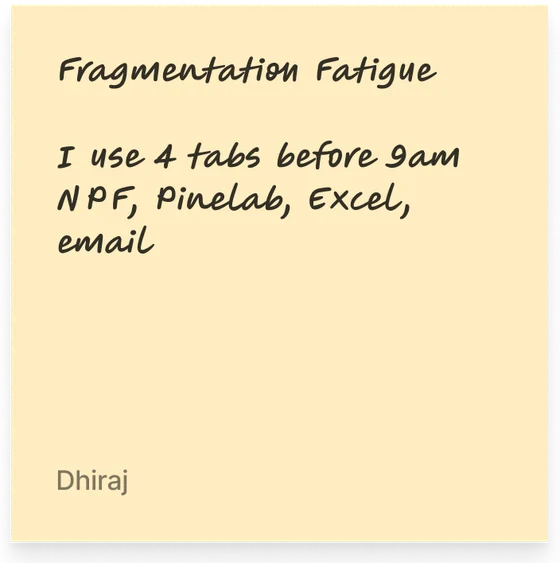
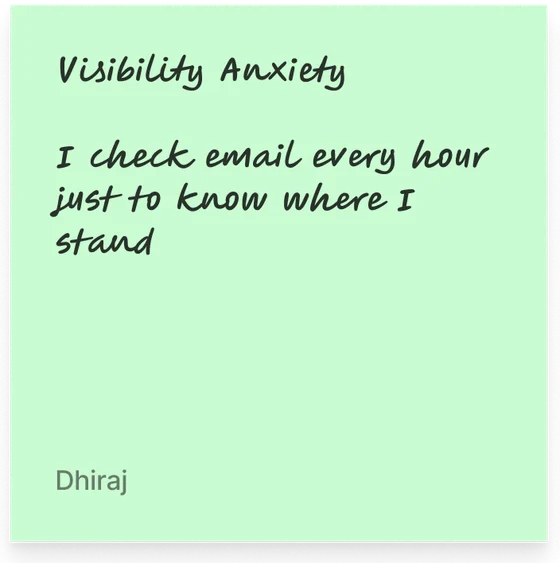
  • Fragmentation Fatigue: I use 4 tabs before 9am. NPF, Pinelab, Excel, email.
  • Visibility Anxiety: I check email every hour just to know where I stand.
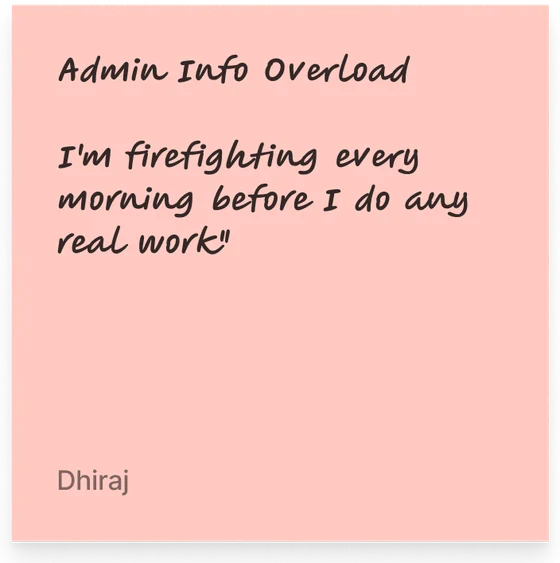
  • Admin Info Overload: I’m firefighting every morning before I do any real work.
  • Counselor Invisibility: My session notes live in my personal email drafts.
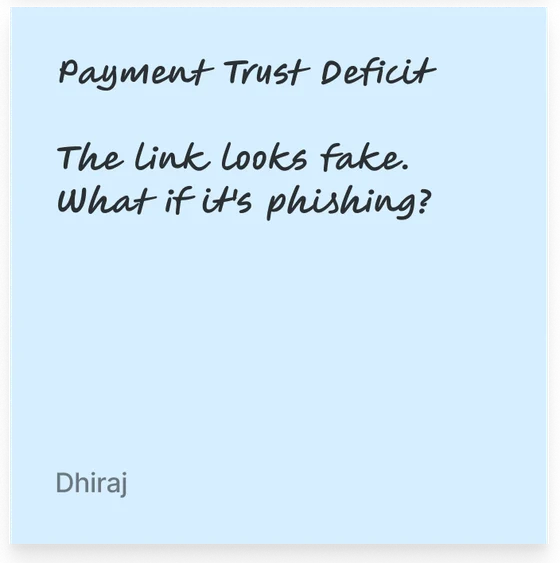
  • Payment Trust Deficit: The link looks fake. What if it’s phishing?

Total: 188 notes clustered across 5 themes
Fragmentation 48 · Visibility 41 · Info overload 41 · Counselor invisibility 32 · Payment trust 26

  • Workarounds were the unmet need. Every role fell back on personal spreadsheets, WhatsApp or email drafts when the official system failed them.
  • Needs changed by time of day. Admins needed a cohort view in the morning and a single-student view in the afternoon.
  • Trust was a design problem. Students and admins both described moments of “is this real?” Branding, confirmation and receipts mattered as much as function.

Part 3

Design

Who we designed for

3 research-backed personas

Built from interview data, not assumptions. Every goal and pain point was mentioned by at least 2 participants in that role.

Aditya Verma

MBA Student · Age 22

A driven MBA student focused on a great job post-graduation, who finds the admission and financial process confusing. He wants one place where everything just works.

Goals

  • Track interview progress and feedback in real time
  • Pay fees without worrying about third-party links or whether payment went through
  • Access counselor reports and meeting history in one place

Pain points

  • Unclear next steps, no visibility into interview stage
  • External payment link felt untrustworthy, no receipt
  • Counselor feedback scattered across sessions
Hears
  • You need to pay your fees via this third-party link.
  • Your interview status will be updated soon.
Sees
Multiple emails with unclear instructions. Other students discussing the process in WhatsApp groups.
Says & does
  • Where do I check my interview status?
  • Did my payment go through? How do I get a receipt?
Thinks & feels
  • I wish there was one place to track everything.
  • Am I missing important deadlines?

Priya Sharma

Admissions & Finance Administrator · Age 42

Manages admissions, financial records and interview tracking across multiple tools daily, handling 2–4 data discrepancy errors a day across NPF, Pinelab, Excel and email.

Goals

  • Reduce manual work in the admission approval process
  • See student finances, transactions and interview status in real time
  • Automate fee processing and refunds

Pain points

  • Too many manual approvals: slow and error-prone
  • Data scattered across NPF, Pinelab, Excel and email
  • Delayed fee verification leads to daily student complaints
Hears
  • We need to approve 50+ applications today.
  • Students are complaining about missing payment confirmations.
Sees
Multiple spreadsheets tracking fee payments. Unorganized email requests for refund approvals.
Says & does
  • I need to check multiple systems to track student applications.
  • Compiles manual reports each morning.
Thinks & feels
  • I spend 4 hours a day just reconciling data.
  • Why can’t I see a student’s full journey in one place?

Dr. Rajeev Menon

Faculty & Student Counselor · Age 40

Has mentored students for over a decade. Without a structured system his feedback gets lost in emails, and he has no way to flag at-risk students early.

Goals

  • Give timely, structured feedback after interviews and sessions
  • Track student history and progress in one system
  • Reduce manual note-keeping

Pain points

  • Feedback often gets lost in email drafts
  • Manual documentation takes too much time between sessions
  • Hard to ensure students follow up
Hears
  • Your session notes weren’t attached to the student record.
  • A student from last month missed their follow-up.
Sees
No structured view of students he has counseled. Students re-explaining context he should already know.
Says & does
  • My session notes live in my professional email drafts.
  • Manually tracks follow-ups in a personal notebook.
Thinks & feels
  • I’m losing context between sessions.
  • I want to flag at-risk students but there’s no channel.

Motivation

Jobs to be done

UserWhen I…I want to…So I can…
Adminstart my workdaysee every pending action in one viewstop opening NPF, Pinelab and Excel
Adminupdate a student statusdo it in one click with confirmationmove to the next task immediately
Facultyfinish a counseling sessionlog notes right there in the platformnot lose context or forget follow-ups
Studentcheck my admission statussee it instantly, no emailsstop anxiously checking my inbox
Studentpay my semester feecomplete it inside one trusted platformhave proof and peace of mind

End to end

User journey

Every role mapped across seven stages, including where the flow breaks.

  1. 1 · Intake

    • Submit applicationvia website
    • Complete?
    • Incomplete-docs email
    • Upload CSV from NPFbatch · weekly
    • CSV validation error
    • 2 · Scheduling

      • Wait for slot
      • Slot invite receivedemail + Calendar
      • Schedule + send invitesbulk · 1-click
      • 3 · Interview

        • Attend interviewvideo / in-person
        • No-show
        • Track interview statuslive dashboard
        • Faculty no-show: reassign
        • Score candidate
        • Score overdue >48h
      • 4 · Decision

        • Admissions decision
        • Full 100%
        • Partial 25–75%
        • No scholarship
        • Rejected
        • Reschedule
        • Decision Boardpanel + admin
        • Tie-break: founder
        • 5 · Offer

          • Receive offer letterBranded · MU
          • Accept?
          • Decline / lapse 7d
          • Auto-trigger offer letterbranded · 1-click
          • 6 · Payment

            • Payment path
            • Pinelab (full)
            • Loan / EMI
            • Deposit 1/3 · 1/6 · 1/12
            • Payment failed (x3)
            • Abandoned >24h
            • Track paymentsreal-time
            • 7 · Enrollment

              • Enrolled: Dashboard
              • Auto-syncNPF + CRM + Excel
              • Sync conflict: manual merge
              • Step
              • Decision
              • Success end
              • Edge case
              • Critical edge

              5 critical handoffs, where student and admin lanes interact

              1. H1 · Application

                Admin CSV → Student Portal

                Duplicate / invalid row

              2. H2 · Slot Invite

                Scheduler → Student inbox

                Wrong tz / bounce

              3. H3 · Decision

                Faculty + Admin → Student

                Same-day SLA miss

              4. H4 · Offer Letter

                Admin → Student (Pinelab)

                Un-branded (legacy)

              5. H5 · Payment confirm

                Pinelab → CRM/NPF/Excel

                Sync race condition

              Information architecture

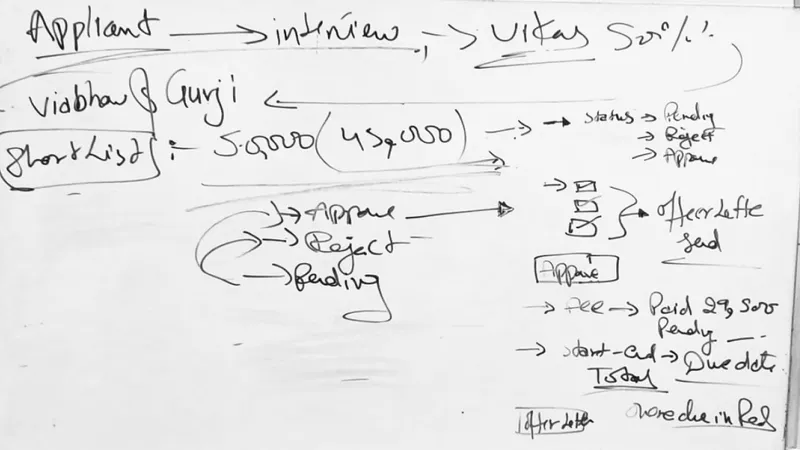
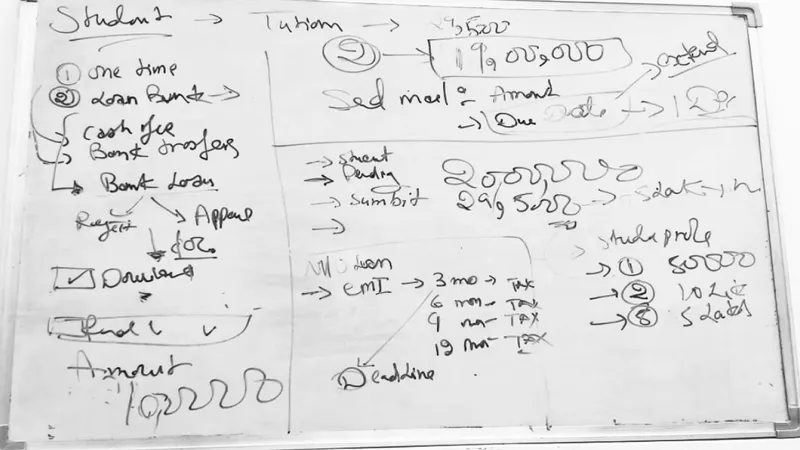
              User flow

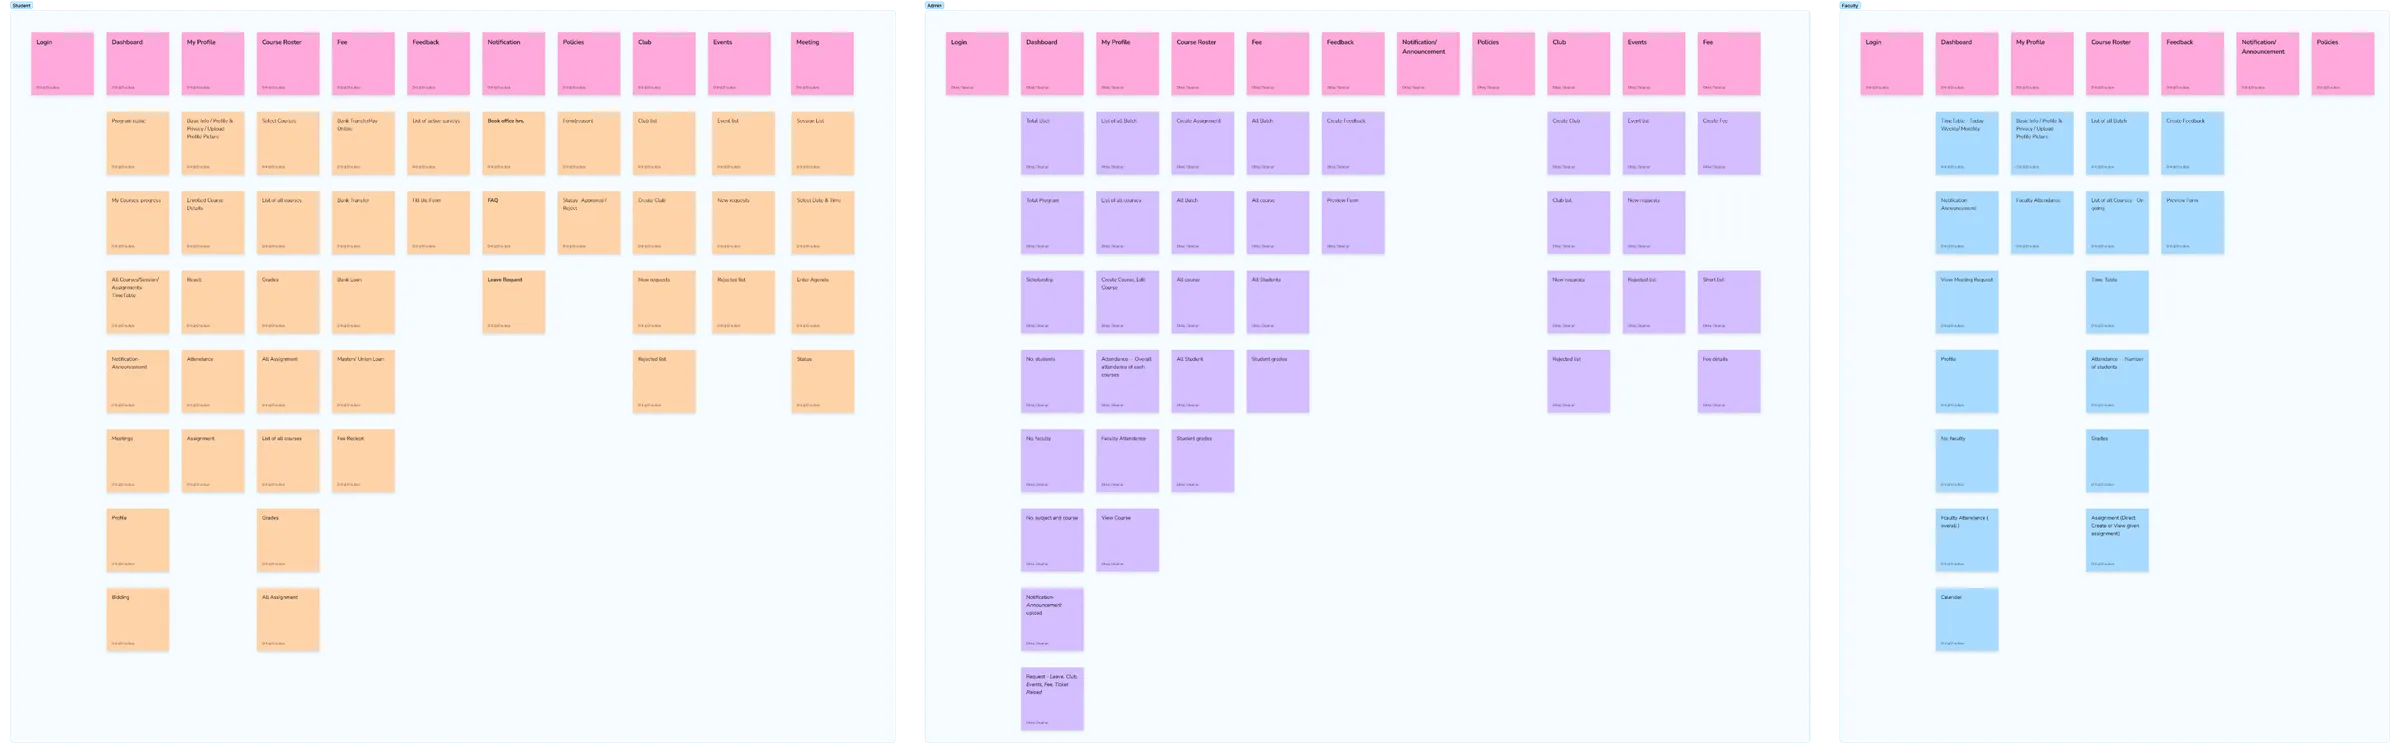
              Categories emerged through participant-led grouping during interviews and affinity mapping, then were validated in a design-team workshop before wireframing.
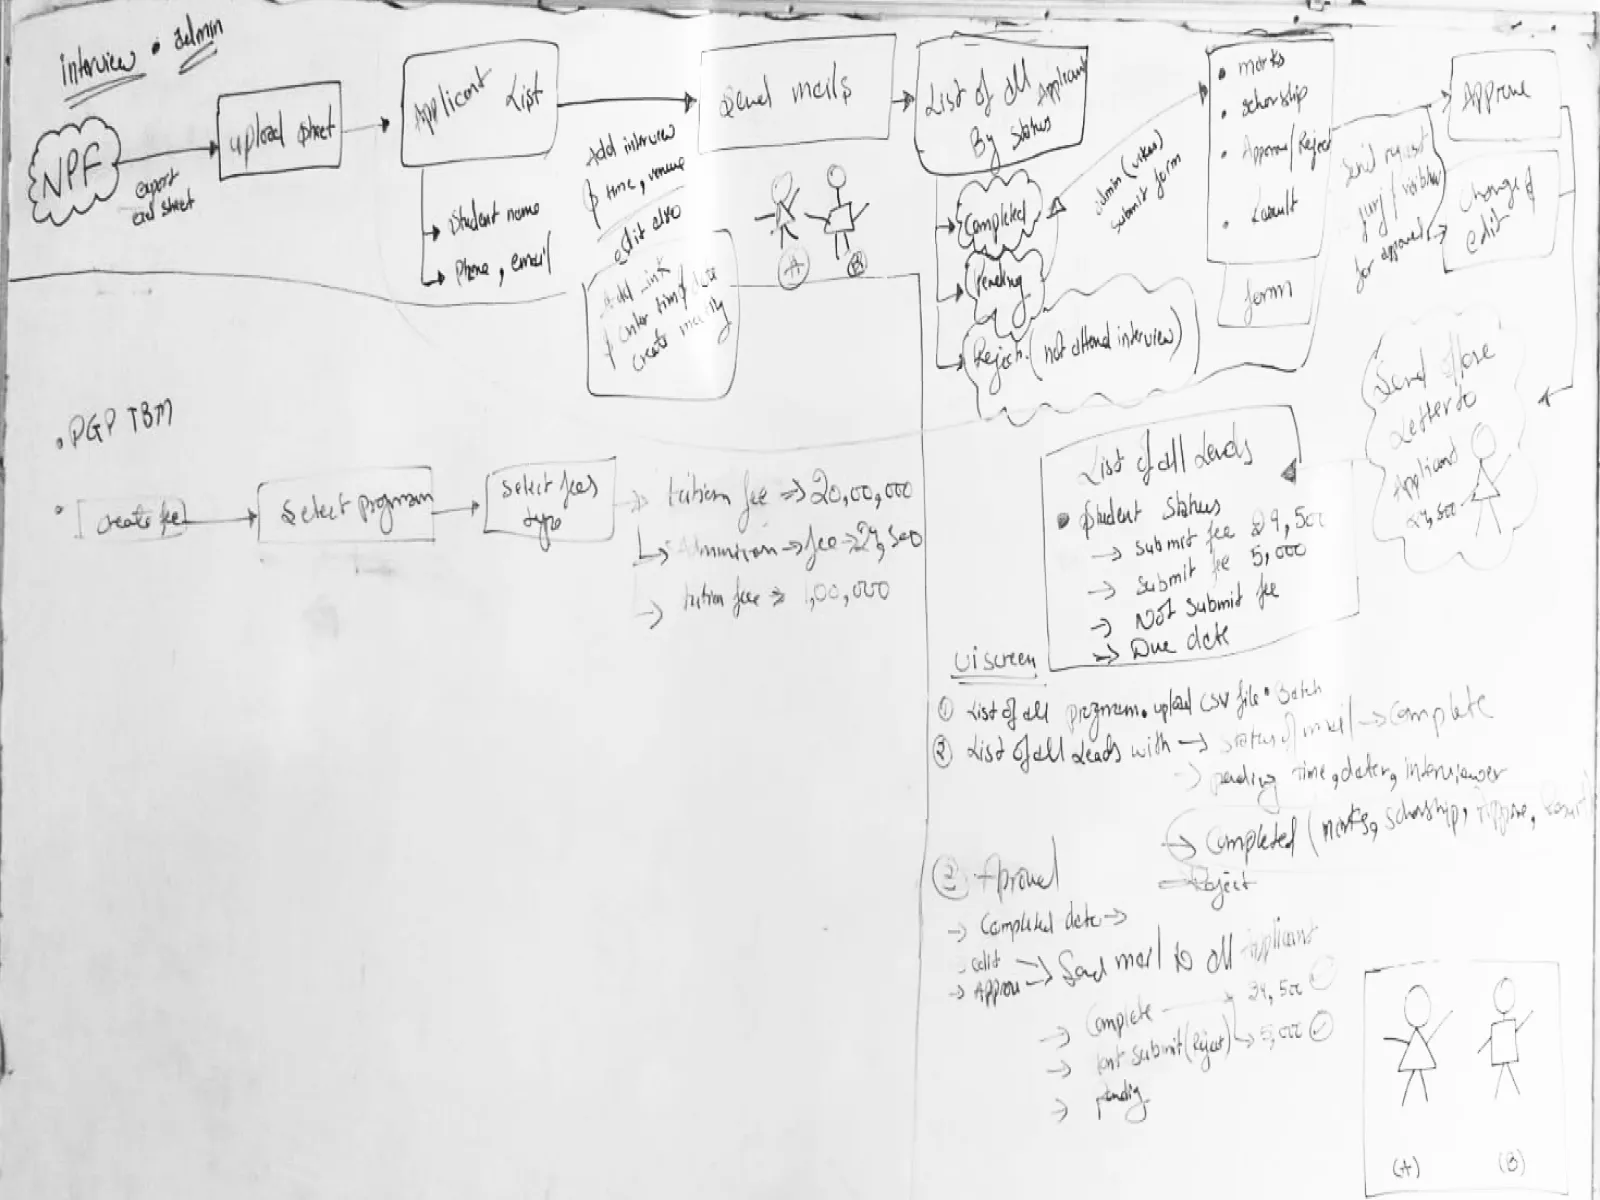
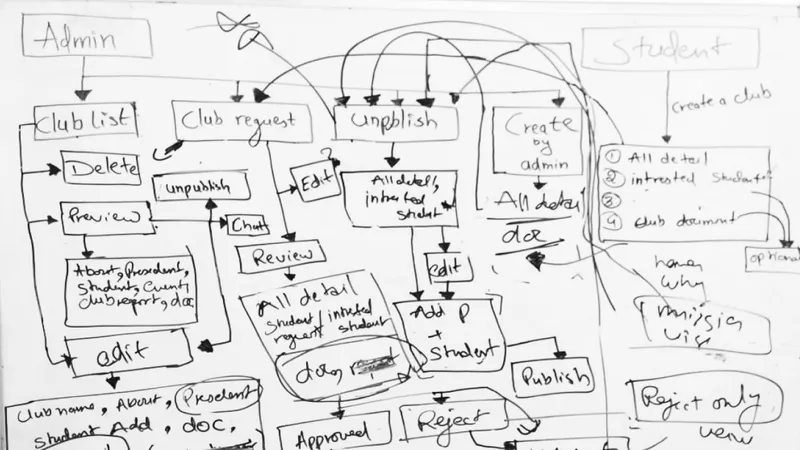
              Whiteboard sketch of the main admissions flowWhiteboard sketch of the admin flowWhiteboard sketch of the applicant flowWhiteboard sketch of the student flow
              Three sticky-note boards grouping features into categories for each role

              Sketch to hi-fi

              Wireframing

              Step 1

              Applied Finance Cohort View

              Sketch intent

              Admin dashboard with cohort rows, expandable program categories and a single CTA to create program

              What changed in hi-fi

              Added cohort summary actions, refresh cashflow control and clear program/cohort hierarchy
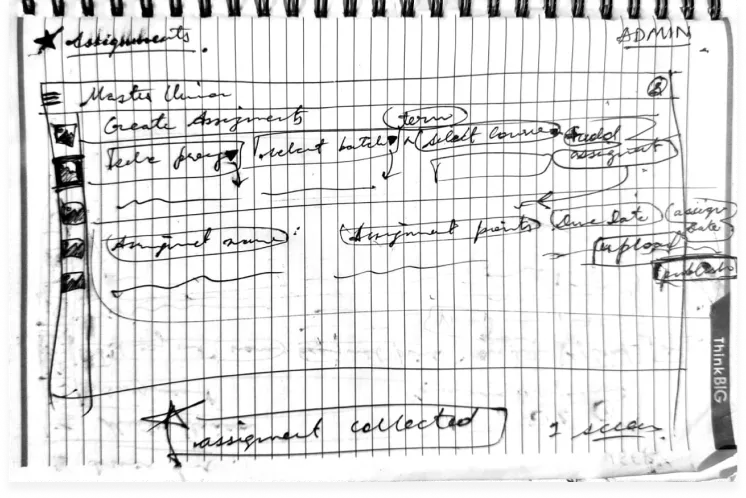
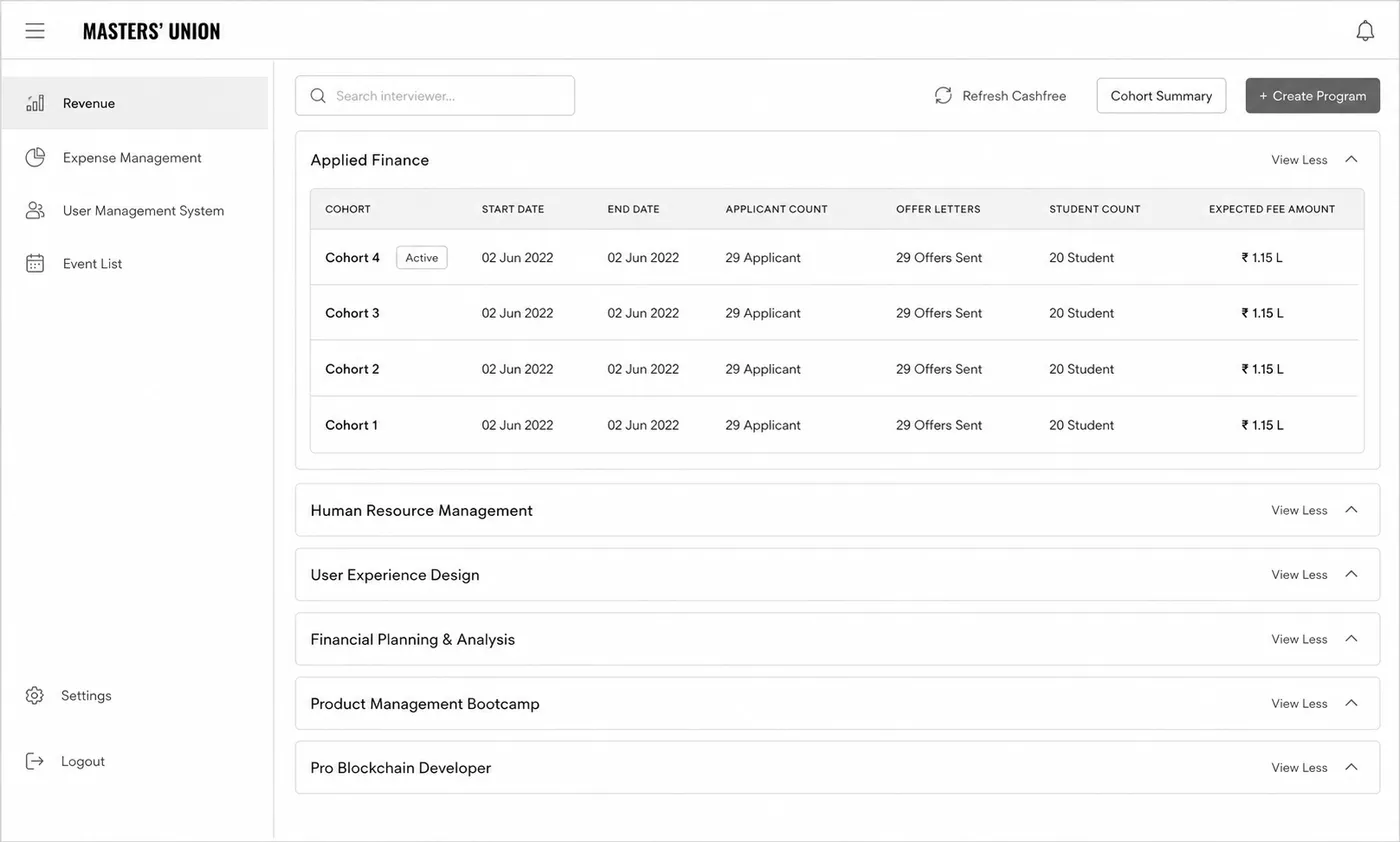
              Notebook sketch: Applied Finance Cohort ViewFinal interface: Applied Finance Cohort View

              Result: Single-screen view replaced cross-tab NPF + Excel reconciliation

              Step 2

              Bulk Communication Module

              Sketch intent

              Modal form for campaign-style outreach with name, type, sender, recipient and template

              What changed in hi-fi

              Added rich-text editor, predefined template selector and inline message preview
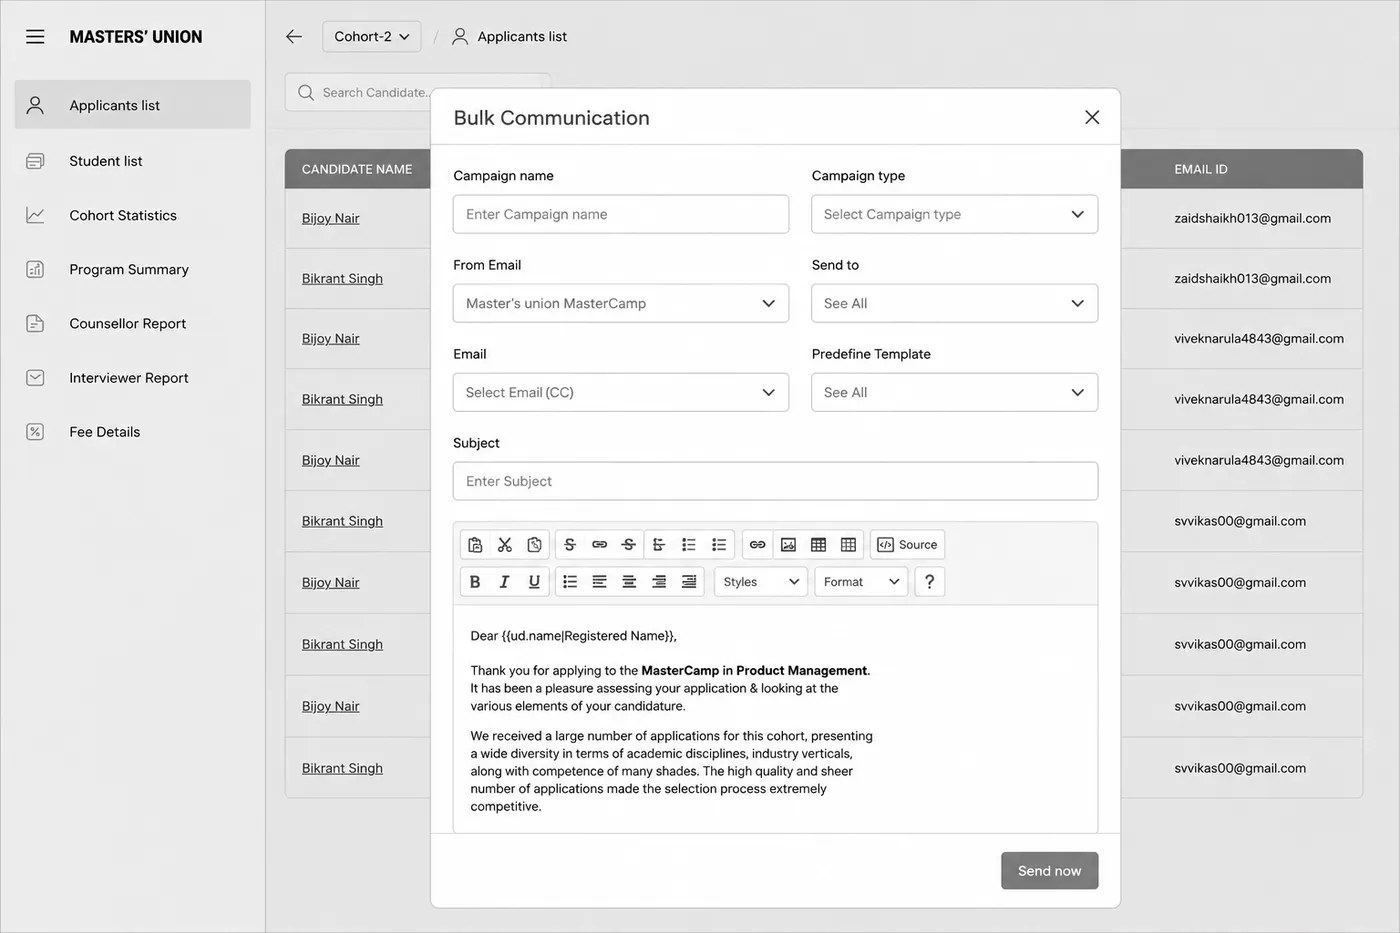
              Notebook sketch: Bulk Communication ModuleFinal interface: Bulk Communication Module

              Result: Bulk-send replaced manual email loops for offer letters, welcome messages and reminders

              Step 3

              Applicants List with Interview Tracking

              Sketch intent

              Applicant table with counsellor name, interview status and contextual actions

              What changed in hi-fi

              Added search, filters, counsellor assignment and bulk Send Mail / Delete actions
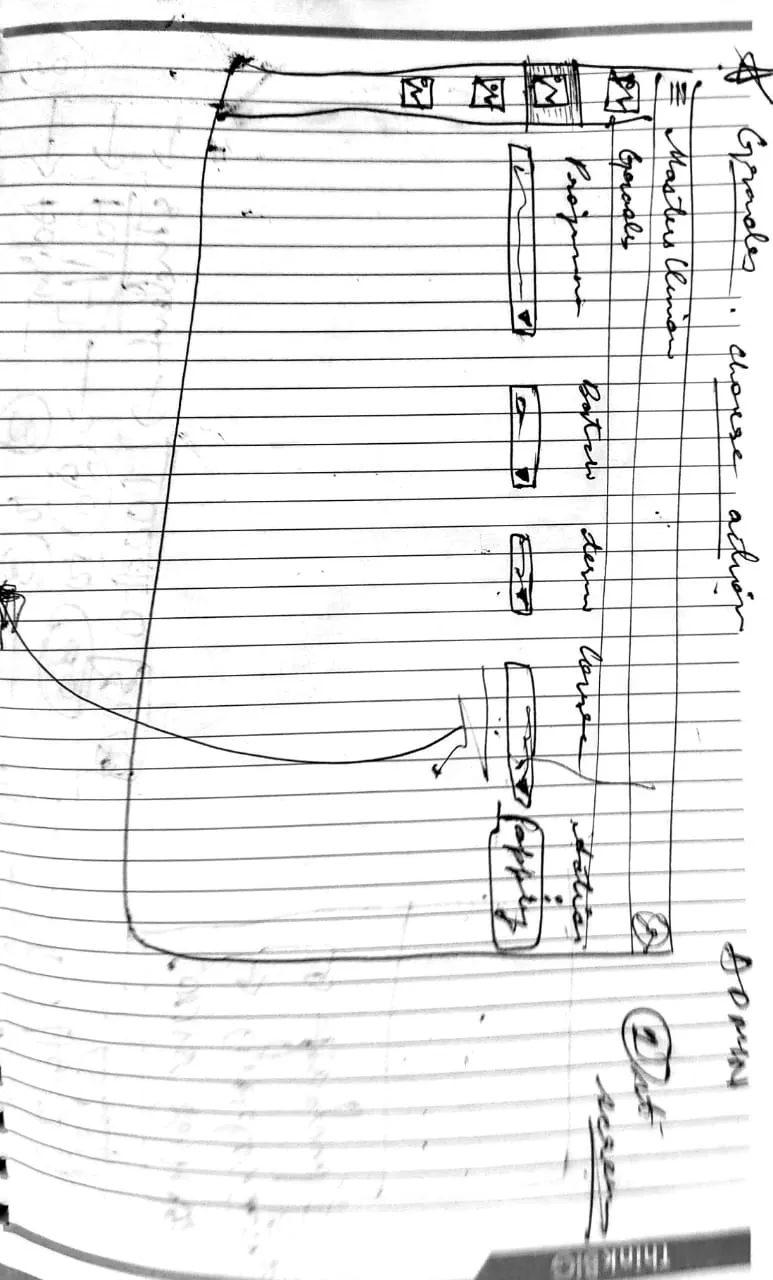
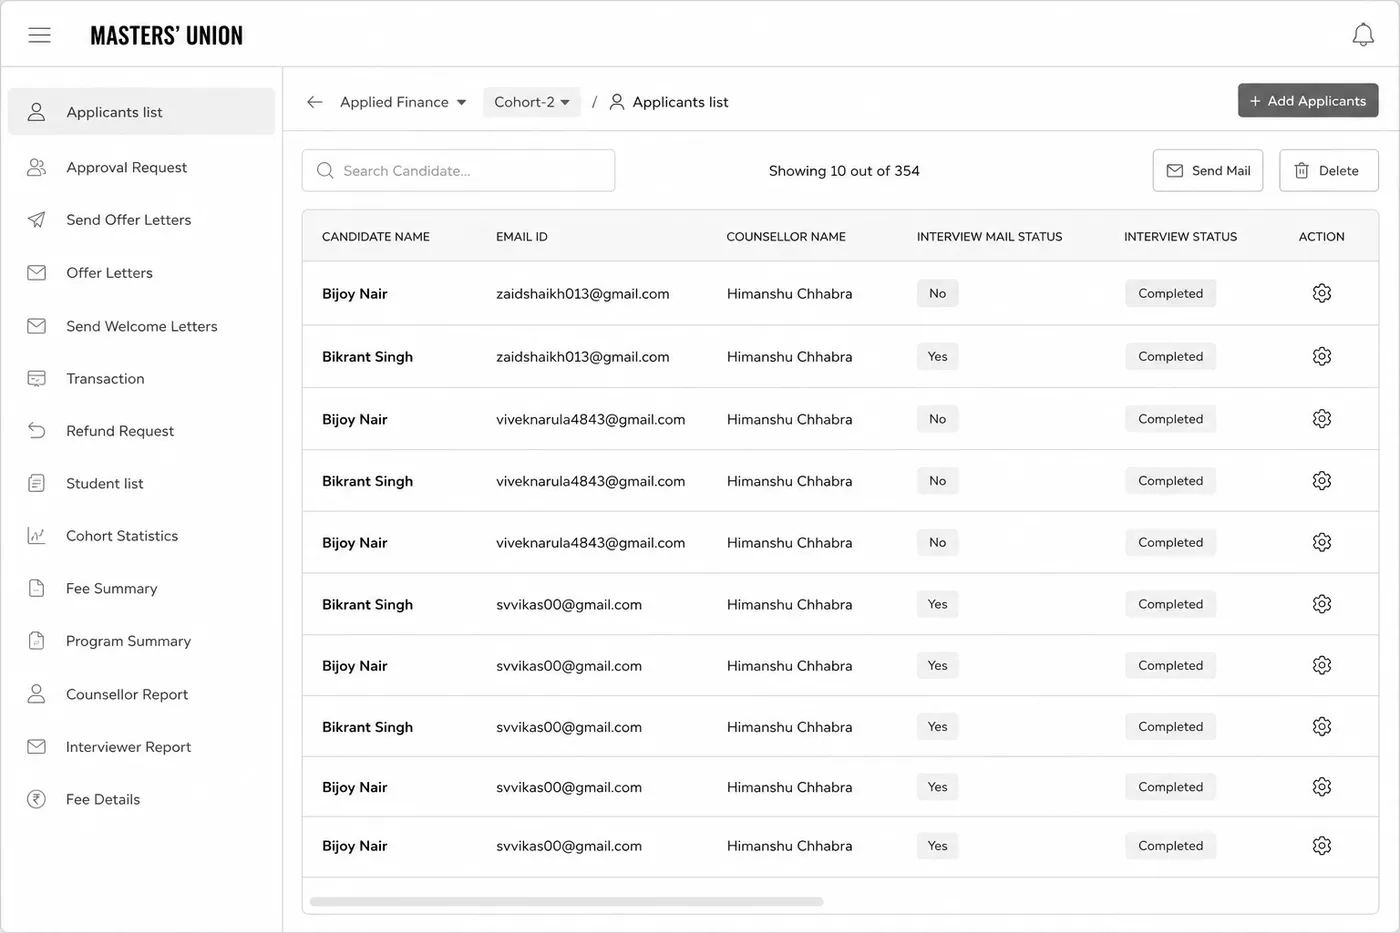
              Notebook sketch: Applicants List with Interview TrackingFinal interface: Applicants List with Interview Tracking

              Result: Interview tracking moved from Excel polling to a real-time admin dashboard

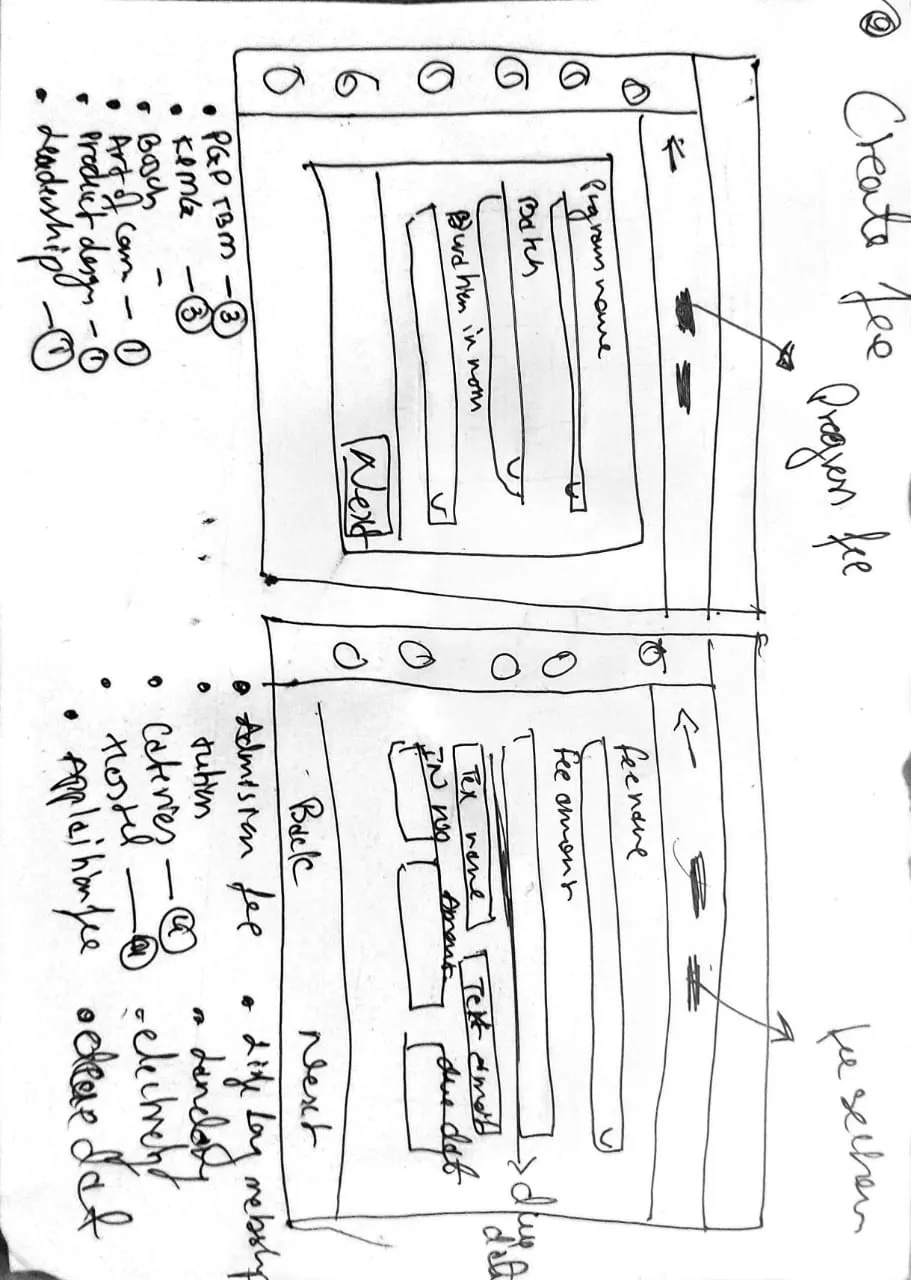
              Step 4

              Create New Program Modal

              Sketch intent

              Overlay modal for adding a new program with program/cohort/duration/fee fields

              What changed in hi-fi

              Added Tax name + Tax % fields, Create Tax inline action and structured fee-name dropdown
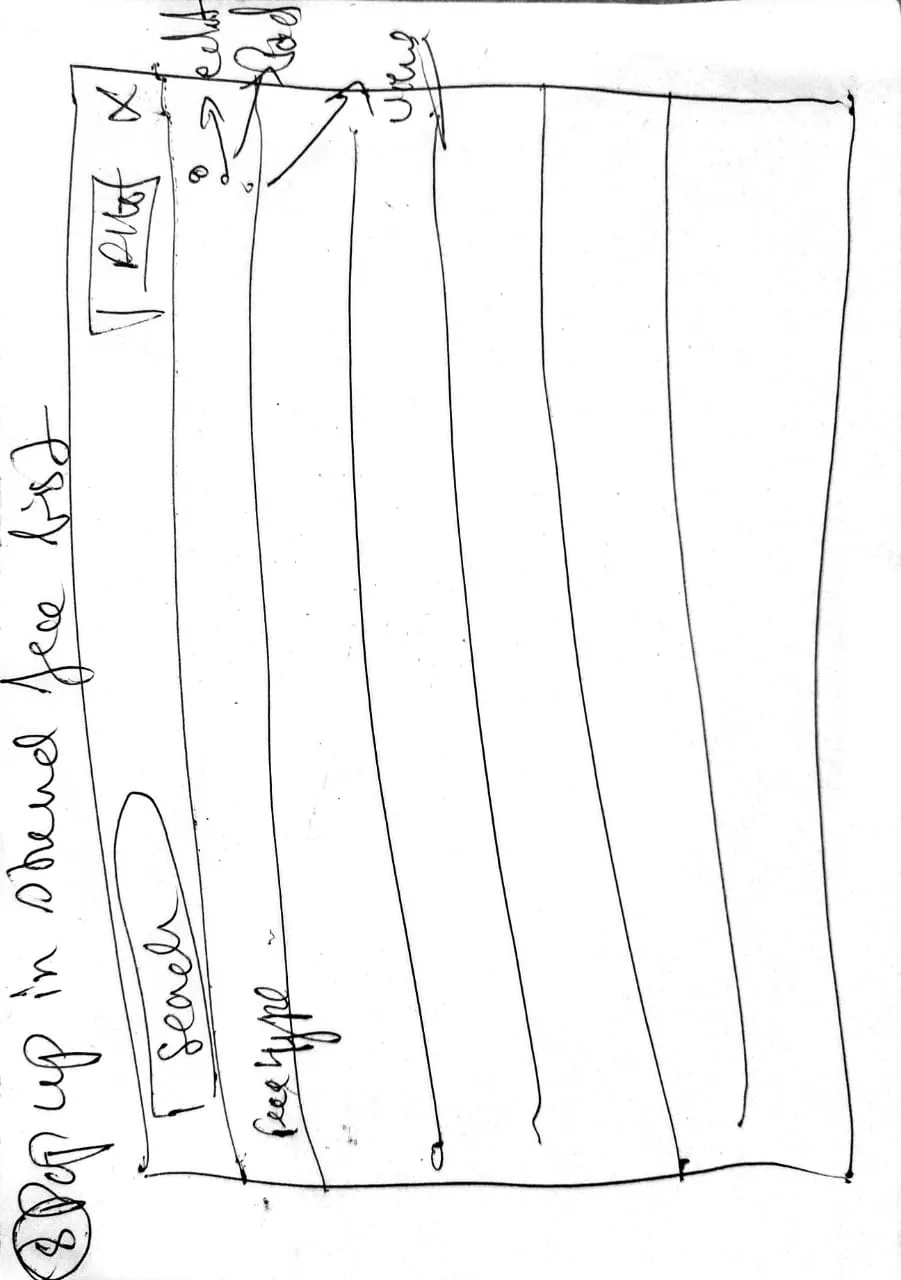
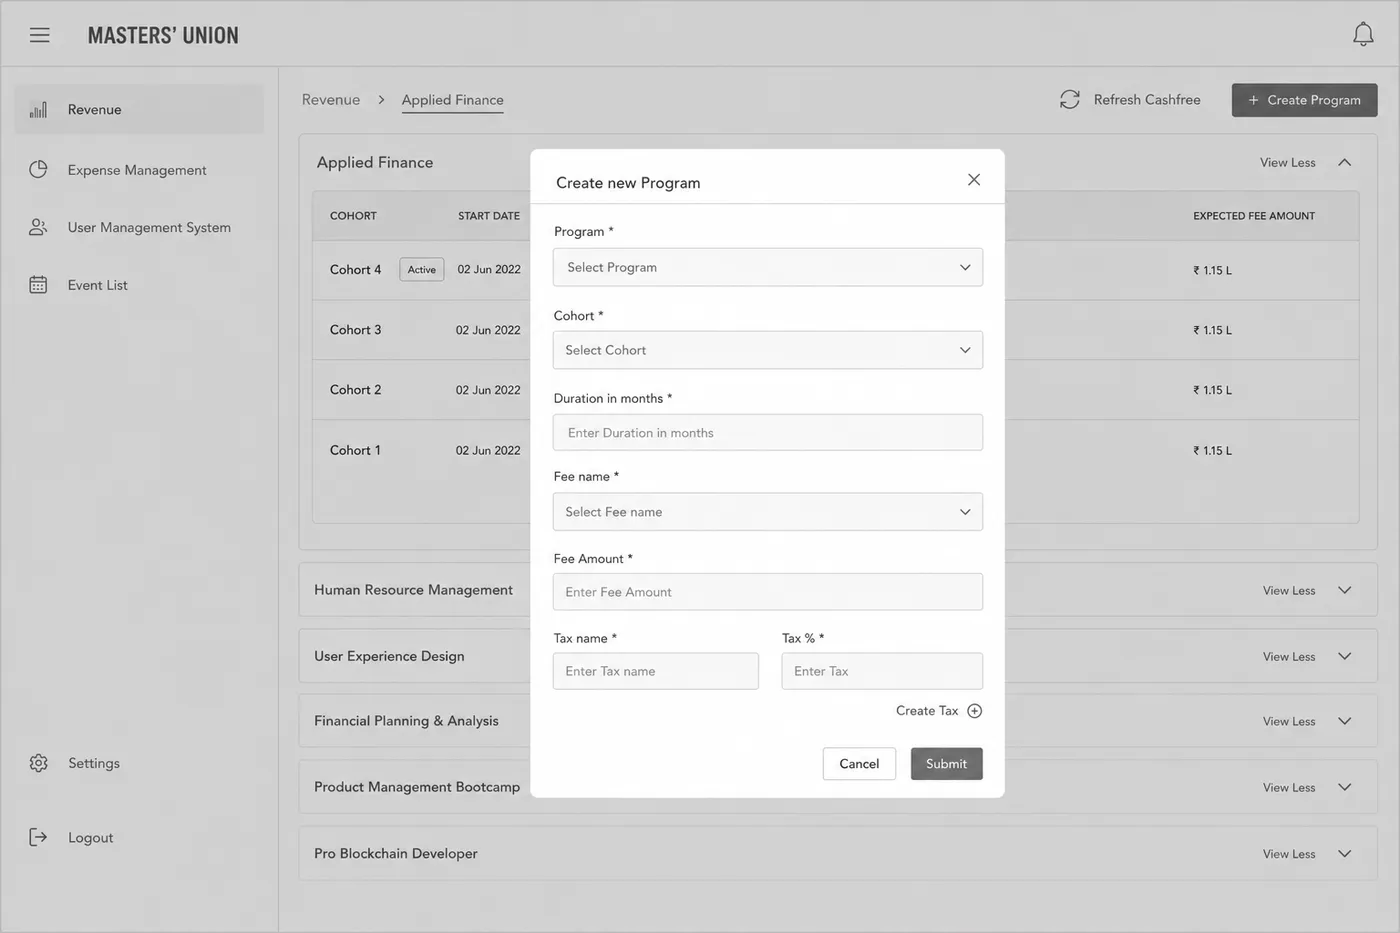
              Notebook sketch: Create New Program ModalFinal interface: Create New Program Modal

              Result: Admins create programs in one form instead of three NPF + Excel + manual entry steps

              Step 5

              Send Offer Letters with Scholarship Logic

              Sketch intent

              Dashboard with applicant count, offer count, student count and student status breakdown

              What changed in hi-fi

              Added Payment Mode cards, real-time amount aggregation and ₹ figures
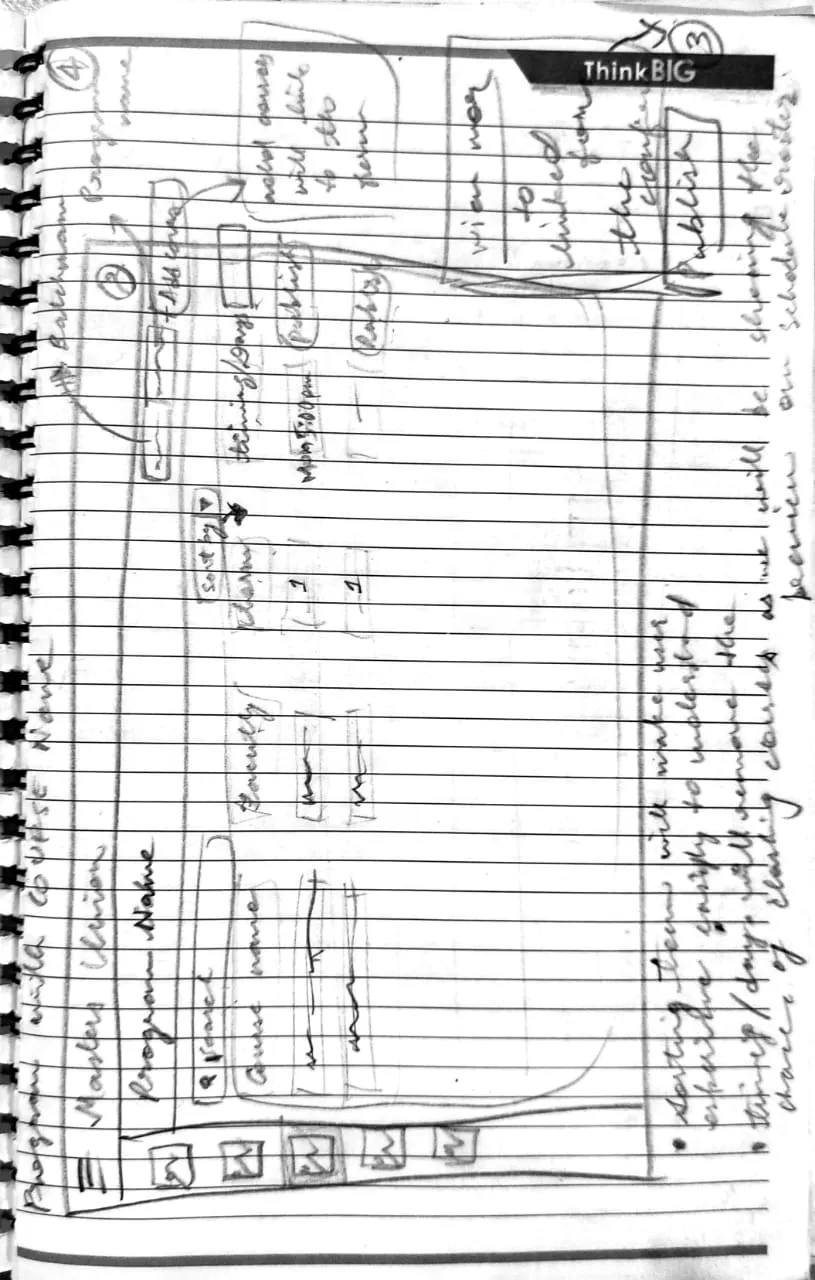
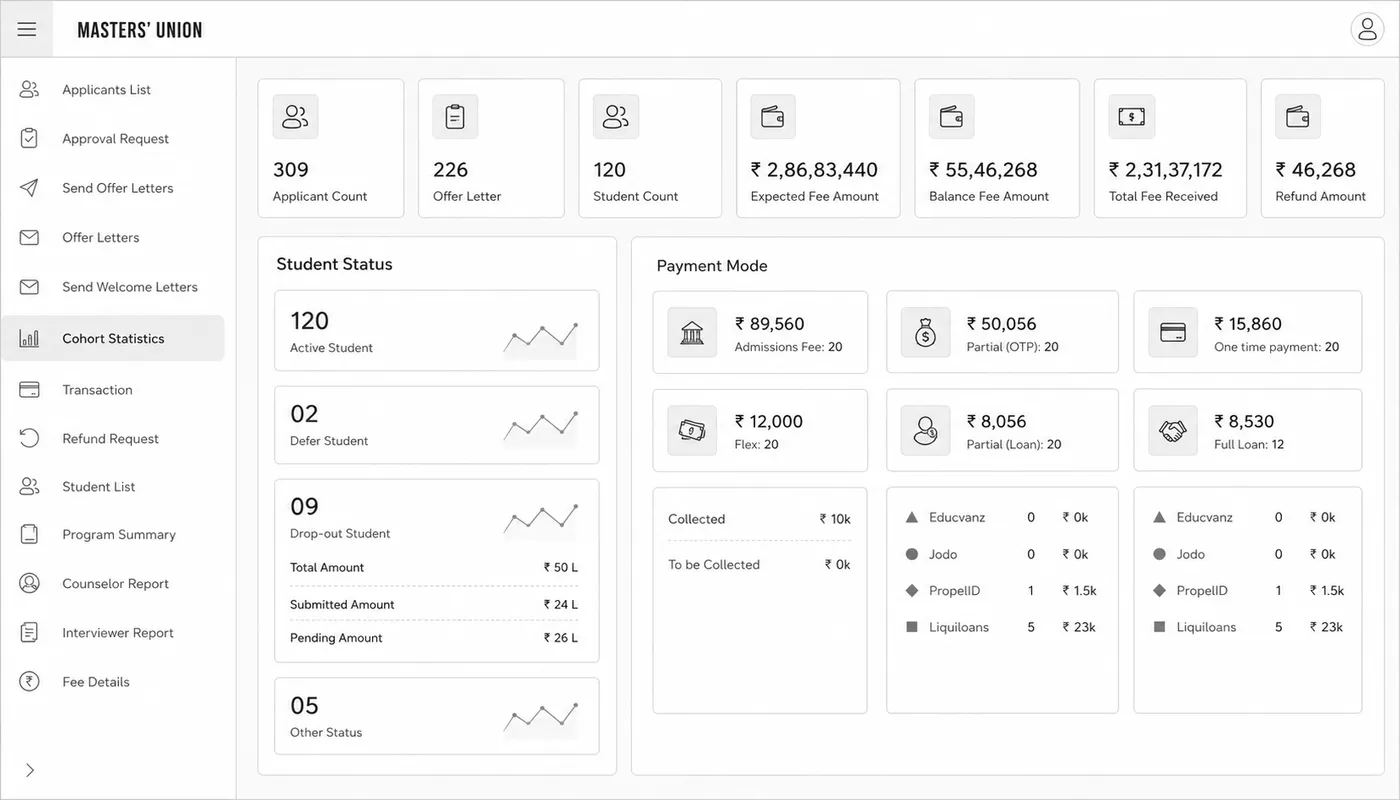
              Notebook sketch: Send Offer Letters with Scholarship LogicFinal interface: Send Offer Letters with Scholarship Logic

              Result: Replaced 4 morning-reconciliation tools with one live dashboard

              1 / 5

              Validation

              Usability testing

              Two moderated rounds, four weeks apart: mid-fi first, then the hi-fi build. The goal was to find what was broken while fixes were still cheap.

              64% → 87%
              Task success, Round 1 to Round 2
              7
              Critical issues found before any code
              • You’ve just received your offer letter. Please pay your first semester fee using Dinero.

                Scenario 1Student Payment Flow

                Payment completed within 5 minutes

              • You just completed an interview with a candidate. Please update their status to “Shortlisted”.

                Scenario 2Admin Candidate Management

                Status updated within 30 seconds

              • A student just completed their counseling session. Please log your notes and set a follow-up reminder.

                Scenario 3Counselor Follow-up

                Note saved and reminder set within 60 seconds

              Part 4 · Outcome

              Final UI

              The screens shipped because the research justified them, the wireframing tested them and the design system made them coherent.

              Loading video

              Measured

              Impact

              Five months of research and design changed how Masters’ Union runs admissions.

              Task success rate

              87%

              +23 pts

              Baseline: 64%R2 result: 87%

              Payment completion

              93%

              +19 pts

              Baseline: ~74%

              Admin manual effort

              <1 hr/day

              −80%

              Baseline: 3–5 hrs/dayTarget: < 1 hr/day

              Tool consolidation

              3 → 1

              −2 platforms

              Baseline: NPF + Excel + Pinelab

              Reflection

              What I took away

              1. 01

                Stakeholders misattribute problems, research locates them

                Leadership believed students weren’t completing payments. Research showed a trust failure: students were willing to pay, but the experience felt unsafe. The fix wasn’t a reminder email, it was embedding the gateway.

              2. 02

                Observation reveals what interviews cannot

                Admins said 1–2 hours of daily overhead. Observation showed 3–5. They had normalized the effort. I now default to observation-first for workflow-heavy users.

              3. 03

                Test early enough to fail cheaply

                Round 1 found 7 critical issues before a line of code. Fixing them in Figma took hours; after development it would have taken weeks.

              4. 04

                The design system is a research artifact

                Three role-based dashboards with different mental models still had to feel like one product. The 30-component token system encoded that requirement.